The Ultimate Guide to the Net Promoter Score® (NPS): Beginner Level
Everything You Need To Know About NPS®! (Level Beginner)

8 minute read
The Ultimate Guide to the Net Promoter Score is designed for all (Beginner, Intermediate, Proficient and Expert) levels of NPS® practitioners. The aim of this guide is to consolidate everything you need to know about the Net Promoter Score/Net Promoter System on a single platform.
This guide encompasses everything from understanding to implementation to the success of NPS initiatives. The guide is divided into 4 parts to make it easier for you to come back and continue reading from where you left-off. You are currently reading the ‘Level: Beginner’ guide to NPS®.
At the end of the 4-part guide is a quiz that you can take to test your knowledge and learnings from this guide. Happy upskilling!
Before we begin, here is a quick disclaimer about the Net Promoter Score/System:
Net Promoter, Net Promoter Score and NPS are registered trademarks of Bain & Company, Inc., Fred Reichheld and Satmetrix Systems, Inc. All titles, content, publisher names, trademarks, artwork, and associated imagery are trademarks and/or copyright material of their respective owners.
With that said, let’s begin our journey towards dramatic improvements!
In this section:
- What is NPS®?
- What is the NPS® Scale?
- How is the Net Promoter Score Calculated?
- How is NPS® different from CSAT and when should either of them be used?
- What are the types of NPS®?
Q1. What is NPS®?
Net Promoter or Net Promoter Score (NPS®) is a management tool that can be used to gauge the loyalty of a firm’s customer relationships. The tool aims to measure the loyalty that exists between a provider and a consumer. The metric was developed by (and is a registered trademark of) Fred Reichheld, Bain & Company and Satmetrix. It was introduced by Reichheld in his 2003 Harvard Business Review article “One Number You Need to Grow”.
Considering that the concept was introduced in 2003, followed by the advent of handheld connected devices, the adoption has increased exponentially and what started as a metric to measure customer loyalty, has now evolved into a system and is now more commonly adopted as the Net Promoter System. However, in this article, we shall refer to NPS® as the Net Promoter Score for the sake of easy understanding.
To know more about Bain & Co.’s take on NPS®, check out this page!
Q2. What is the NPS® Scale?
The Net Promoter Score is calculated based on responses to a single question: How likely are you to recommend our company/product/service to a friend or colleague?
The scoring for this answer is most often based on a 0 to 10 scale.
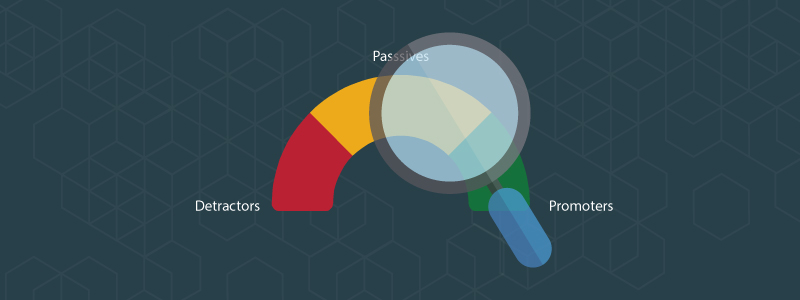
Those who respond with a score of 9 to 10 are called Promoters and are considered likely to exhibit value-creating behaviours, such as buying more, remaining customers for longer, and making more positive referrals to other potential customers. Those who respond with a score of 0 to 6 are labelled Detractors, and they are believed to be less likely to exhibit the value-creating behaviours. Responses of 7 and 8 are labelled Passives, and their behaviour falls between Promoters and Detractors.
While just measuring is not enough, it is important to act and improve on customer experiences and hence the scale can further be subdivided into 3 categories:
- Detractors (0-6)
- Passives (7-8)
- Promoters (9-10)
We shall delve into each of these in detail while we learn how to design the NPS® Questionnaire.
Click here to know more about the top 5 CX metrics you need to track!
Q3. How is the Net Promoter Score Calculated?
The Net Promoter Score is the (% Promoters – % Detractors). The final outcome can go as low as -100 to as high as +100. However, if you have a large number of customers responding to your feedback request and you see a perfect score, you may want to revisit the calculations and identify the abnormalities. Sounds too good to be true!
Going by the above formula, if you have 60% promoters, 15% passives and 25% detractors, your effective NPS® score now is 60-25 = 35 percentage points.
Note: Passives are excluded from the calculation. However, a high number of passives can impact your overall NPS® scores despite having a lower number of Detractors.
We spotted a great NPS® calculator online. You can check it out here.
Q4. How is NPS® different from CSAT and when should either of them be used?
While the former helps in evaluating the loyalty of your customers, the latter helps in identifying the level of satisfaction for your product/services provided.
CSAT is typically based on a number of statements that customers rate their agreement or disagreement with e.g. Overall I was satisfied with <product/service>. While NPS® is based on a single question based on a customers’ overall interaction with a company i.e. How likely are you to recommend our company/product/service to your friends and colleagues?
So when I’m asked by a company whether they should be using CSAT or NPS®, my first question is what do you want to measure and why?
- Want to understand what customers think of a specific product or service, or measure the impact of changes to a specific product or service? Then CSAT would be my recommendation.
- Want to measure customer loyalty based on a customers’ perception of their end to end customer journey? Then NPS® is better placed.
NPS®, CSAT, CES are all metrics that fulfil a defined purpose. Here’s what each of these metrics means and when to use them.
Q5. What are the types of NPS®?
High Net Promoter Scores are certainly better than low ones. They indicate that a company has earned more promoters than detractors. But how do we interpret the scores these companies are reporting? What is a good score? How should we set goals and targets for improvement?
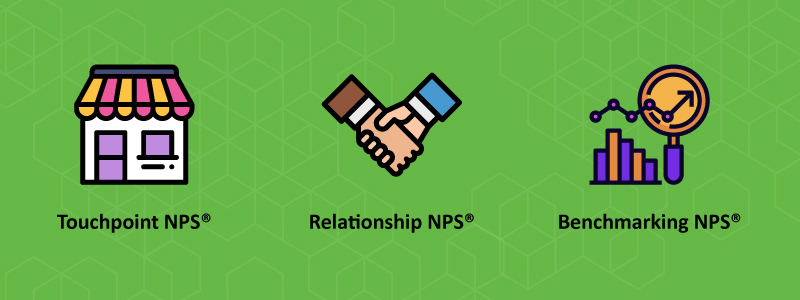
To begin, we should make sure we look at the right sort of Net Promoter Score. Seasoned practitioners of the Net Promoter System gather feedback from their customers in three different ways:
Touchpoint NPS®
This captures the customer’s experience immediately after an interaction to understand how a particular touchpoint like order placement, website, customer support, transaction and so on, affects loyalty.
- Whom should you target: Customers with recent experiences. These may or may not include transacting customers. You can also request feedback from non-transacting customers to identify the reason for drop-offs in the sales funnel
- Should you close-loop: Yes
- Next Steps: Improve the experience design and identify key action areas to bridge the gap between customer perception and service delivery
Relationship NPS®
This involves periodic conversations with customers to understand their overall experience with the brand. This helps in measuring how loyalty gets affected over a period of time.
- Whom should you target: Existing customers, partners, vendors, other businesses that help in delivering the last mile experience (directly or indirectly)
- Should you close-loop: Yes
- Next Steps: Account planning, product/service enhancements, policy optimisation
Benchmarking NPS®
Analyse the experience of customers of a competitor brand to serve as a comparison platform. This aids in deciding what or where to prioritise.
- Whom should you target: Your customers, your competitors’ customers
- Should you close-loop: No
- Next Steps: Data analysis, cross-functional projects like product development, major marketing and cross-functional initiatives driven towards acquiring market share
Each of these types is discussed in detail along with the post-measurement steps here!
Now that you’ve successfully completed ‘Level: Beginner’ guide, let’s move to the ‘Level: Intermediate’ guide to NPS®.

